인텔리J (IntelliJ Tip 모음) 팁 모음
인텔리J에서 제공하는 팁들을 모아봤습니다.
어떻게 사용하는지에 대한 설명을 읽어보시고, 단축키를 외워두시면 좋을 것 같아요.
You can inject SQL into a string literal (Alt+Enter | Inject language or reference | <SQL dialect>) and then use coding assistance for SQL.

Postfix code completion is applied from right to left to avoid backward caret jumps when coding. Type a dot . after the code fragment that you want to change and select the desired option.
To see the suggestion list with postfix templates, you can also press Ctrl+J.

To check which line separators are used in the current file, look at the status bar:

You can easily override methods of the base class by pressing Ctrl+O (Code | Override Methods ).
To implement methods of the interfaces (or of the abstract base class) that the current class implements, press Ctrl+I (Code | Implement Methods ).

Use shortcuts to comment and uncomment lines and blocks of code:
- Ctrl+/ : for single line comments (//...)
- Ctrl+Shift+/ : for block comments (/*...*/)

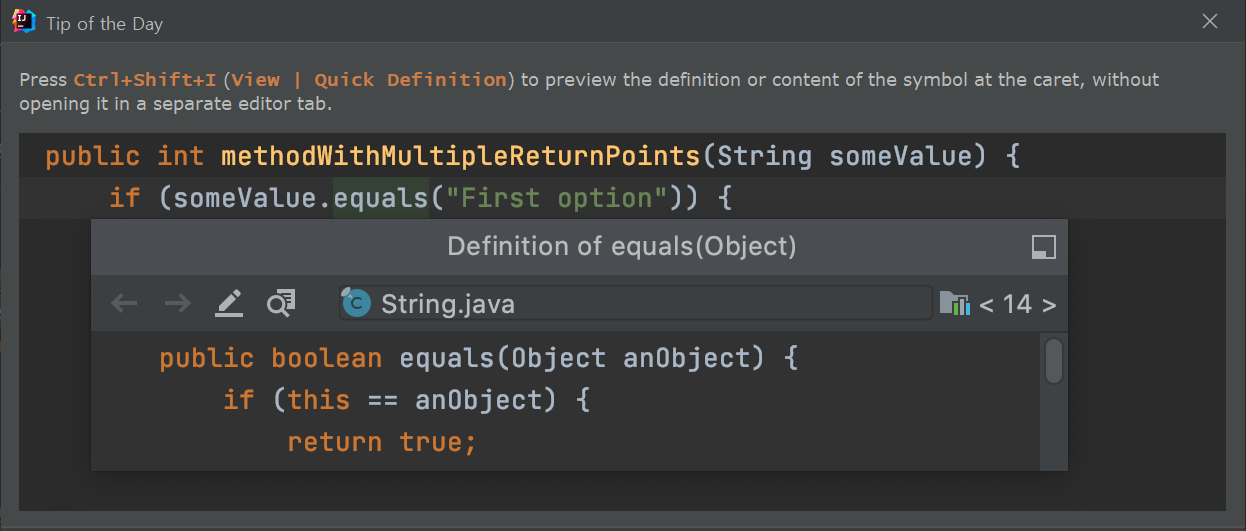
Press Ctrl+Shift+I (View | Quick Definition) to preview the definition or content of the symbol at the caret, without opening it in a separate editor tab.
To add data from the CSV file, drag the file to the tables node of a data source or to the table.
You can view CSV and TSV files as text or as a table.

Press Ctrl+Shift+E to get a list of recently viewed or changed code fragments.

Local history lets you track all changes to files, classes, methods, or any code fragments and roll back to any stable point if necessary. To view local history, from the main menu choose VCS | Current File | Show History.

Invoking Type-Matching code completion (Ctrl+Shift+Space) twice will search for chained expressions of the expected type.

In a Spring application, you can find an endpoint using the Search Everywhere dialog. Press Shift twice and type /url to filter by endpoint URLs. For your convenience, there is also the Go To URL Mapping action mapped to Ctrl+Shift+\.

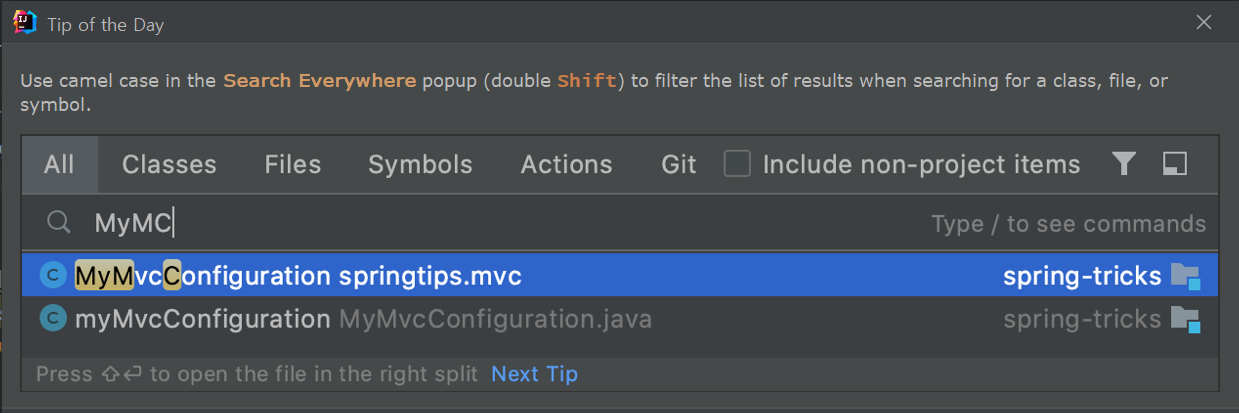
Use camel case in the Search Everywhere popup (double Shift) to filter the list of results when searching for a class, file, or symbol.
If you want to log program state during debugging, use non-suspending breakpoints. Select the expression that you want to log, hold Shift, and click the gutter at the line where the expression should be logged.

When searching for a text string in a file, use recent search history. Press Ctrl+F to open the search pane and then press Alt+Down to show the list of recent entries.

Use Alt+Shift+C to quickly review recent changes to the project.

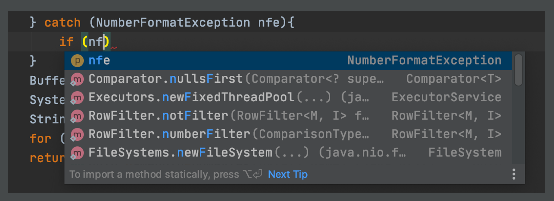
When you use basic code completion Ctrl+Space, type any characters that exist anywhere in an identifier.

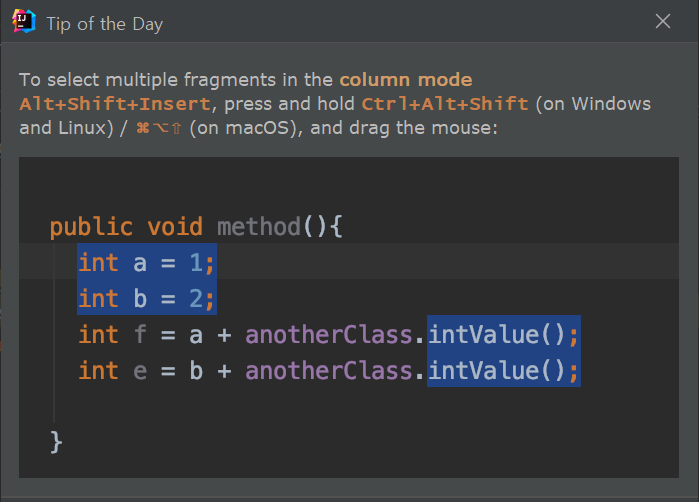
To select multiple fragments in the column mode Alt+Shift+Insert, press and hold Ctrl+Alt+Shift (on Windows and Linux) / ⌘⌥⇧ (on macOS), and drag the mouse:
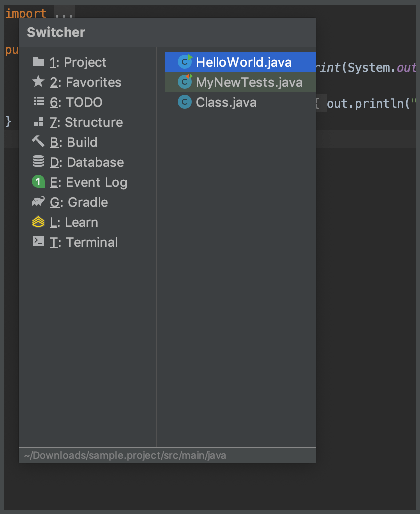
To switch between opened files and tool windows, use the Switcher Ctrl+Tab. For navigation, press and hold Ctrl (on Windows and Linux) / ⌘ (on macOS) and use the Up and Down arrow keys or Tab and Shift+Tab, and Alt.
Press Delete or BackSpace to close an editor tab or hide a tool window.

Scratch files are temporary files that let you experiment and prototype in the editor, without creating any project files.
To create a scratch file, press Ctrl+Alt+Shift+Insert, and then select the language to use.

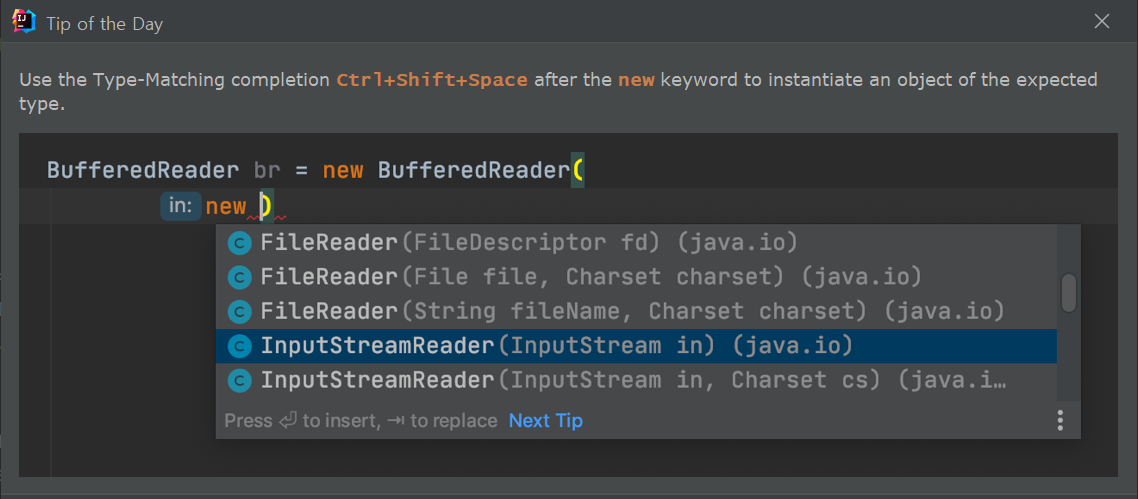
Use the Type-Matching completion Ctrl+Shift+Space after the new keyword to instantiate an object of the expected type.
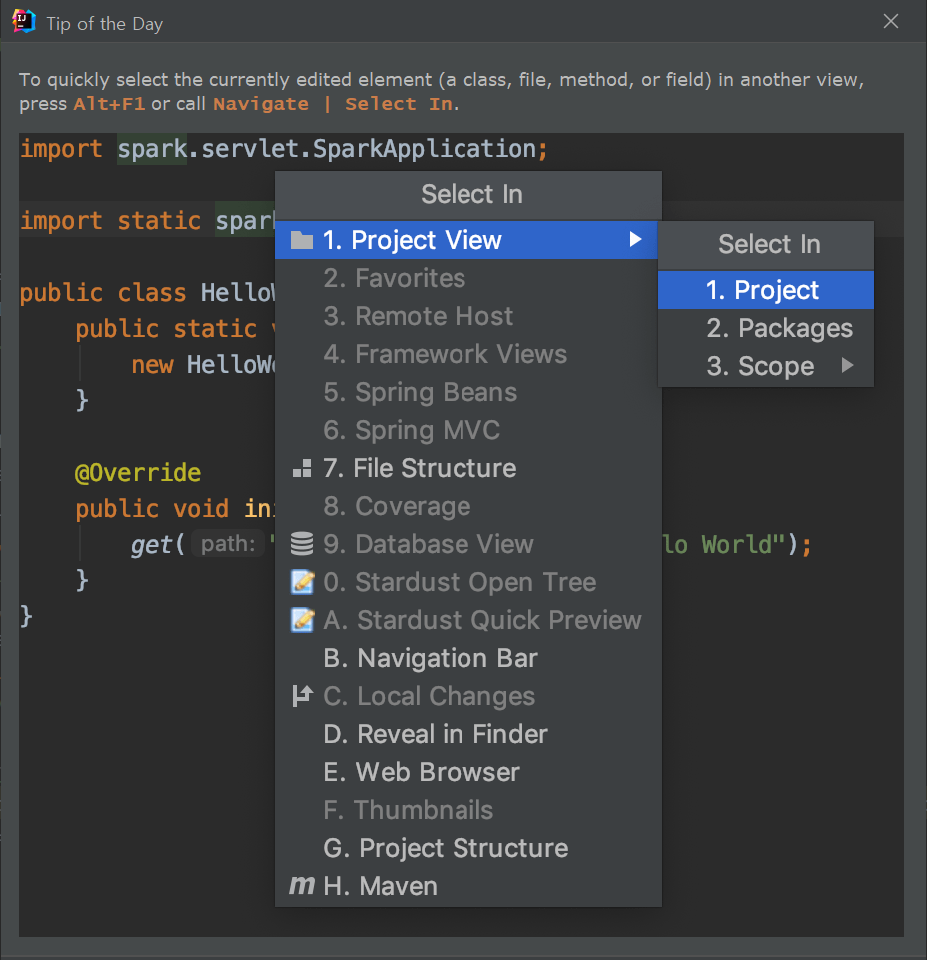
To quickly select the currently edited element (a class, file, method, or field) in another view, press Alt+F1 or call Navigate | Select In.
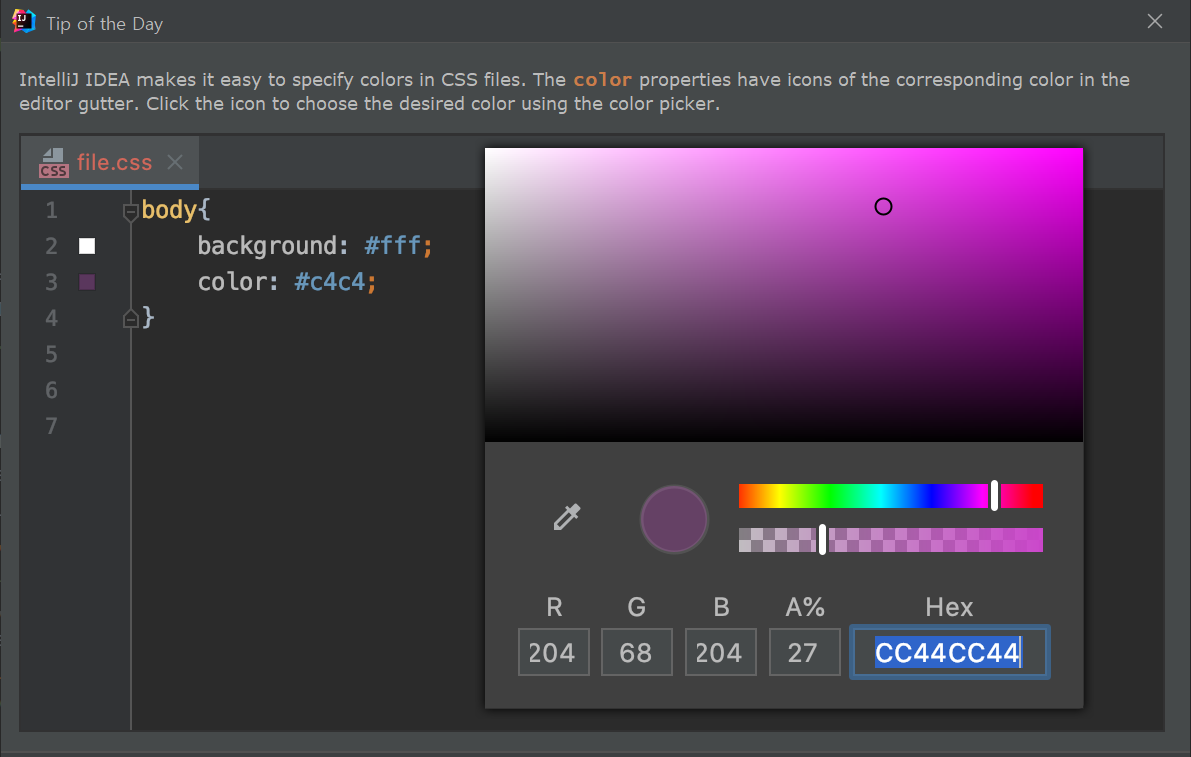
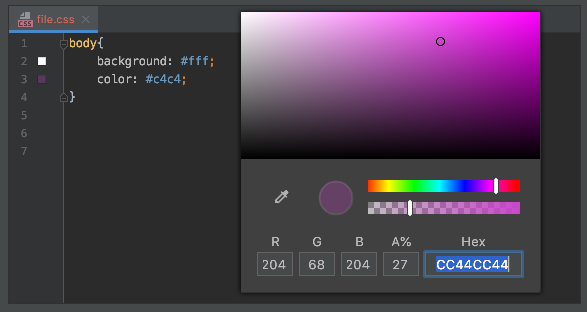
IntelliJ IDEA makes it easy to specify colors in CSS files. The color properties have icons of the corresponding color in the editor gutter. Click the icon to choose the desired color using the color picker.
To navigate to the implementations of an abstract method, position the caret at its usage or its name in the declaration and press Ctrl+Alt+B.

You can jump to a file located in a deeply nested directory by pressing Ctrl+Shift+N and typing several characters of the enclosing directories and filename. Use either a slash or a backslash as a delimiter.

You can open an external file for editing by dragging it from a file browser to the editor.

To create a backup copy of a table, drag the table to the tables node of the same data source in the database tree view. Type a new name and click Run.

Manage your projects efficiently with YouTrack. If you have a YouTrack instance, you can use the YouTrack Integration plugin to work with your issues directly in IntelliJ IDEA.

https://www.jetbrains.com/youtrack/download/get_youtrack.html#section=incloud
Get YouTrack: Issue Tracking and Project Management Tool
Enjoy having everything together in one place. Track tasks, manage projects, keep a knowledge base, collaborate with your team, and deliver great products. Designed with all the members of your team in mind. Free for teams of 10. In our cloud or on your se
www.jetbrains.com
The Type-Matching code completion analyzes the expected type of the whole expression and helps to find methods and variables that are applicable in the current context. It works after the return keyword, in an assignment, in the argument list of a method call, and other places. Press Ctrl+Shift+Space (Code | Code Completion | Type-Matching) to get the completion list filtered.

Basic code completion Ctrl+Space is available in the search field when you search for text in the current file Ctrl+F, so there is no need to type the entire string.

Code Completion can suggest a name for a variable when you declare it. For example, start typing private FileOutputStream and press Ctrl+Space.

You can customize name prefixes for local variables, parameters, instance and static fields in the Settings/Preferences dialog Ctrl+Alt+S under Code Style.
You can view all statements within the method where certain exceptions can be thrown. Place the caret at the throws statement and press Ctrl+Shift+F7.

You can access Spring bean documentation directly from the editor. Place the caret at the bean’s definition in the Spring configuration file, press Alt+F1, and select Spring Bean. The Spring tool window opens showing you all available information.

If you don't like the color of your code, press Ctrl+Shift+A, type Jump, and click Jump to Colors and Fonts. You will be taken to the settings page where you can modify the color of the code element at the caret.

Manage incoming GitHub pull requests directly from IntelliJ IDEA: from the main menu select Git | GitHub | View Pull Requests. IntelliJ IDEA lets you assign and merge pull requests, view the timeline and inline comments, submit comments and reviews, and accept changes without leaving the IDE:

When using code completion, you can accept the current selection in the suggestions list with Ctrl+Shift+Enter. IntelliJ IDEA will not only insert the selected string, but also turn the current code construct into a syntactically correct one (balance parentheses, add missing braces and semicolons, and so on).

You can generate boilerplate code such as getters and setters and implement interface methods using code completion.
Just start typing the would-be name of a method, for example, gn to generate getName() or ct to implement compareTo().

If you see no objects below the schema level, cannot find changes in objects, experience broken tables or any other visualization problems, try to clear the cache and sync the data source again.
To clear the cache, right-click a data source and navigate to Database Tools | Forget Cached Schemas.

Git annotations show detailed information on the origin of each line of code (right-click the gutter and select Annotate with Git Blame ).
Right-click an annotation and choose Show Diff to review the differences between the current and the previous version of the file.

To compare two .jar files or even files inside a .jar archive, select them in the Project tool window and press Ctrl+D.
The Compare Archives feature is integrated with the Java bytecode decompiler and allows you to see what exactly has changed between two different versions of a library.

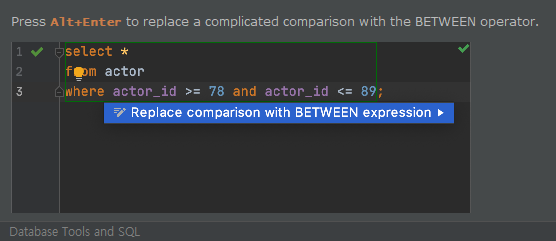
Press Alt+Enter to replace a complicated comparison with the BETWEEN operator.
When you need to cast an expression value to the required type, use Type-Matching completion. For example, type
String s = (
and press Ctrl+Shift+Space to see what happens.
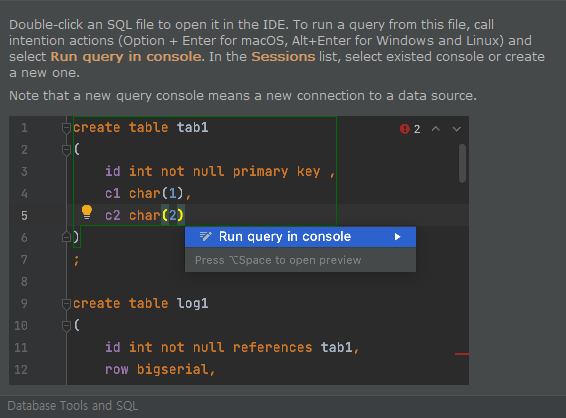
Double-click an SQL file to open it in the IDE. To run a query from this file, call intention actions (Option + Enter for macOS, Alt+Enter for Windows and Linux) and select Run query in console. In the Sessions list, select existed console or create a new one.
Note that a new query console means a new connection to a data source.
IntelliJ IDEA provides several Kotlin project types:

You can use the Preview area of the Find in Files dialog (Ctrl+Shift+F) for quicker search without leaving the dialog. The Preview dialog displays the first 100 results.
Adjust the IntelliJ IDEA tool windows layout to make better use of your screen area.
Toggle between the vertical and side-by-side placement of the tool windows by pressing Ctrl+Click (on Windows and Linux) / ⌘+Click (on macOS) on the splitter.
Press Ctrl+D in the editor to duplicate the selected block, or the current line when no block is selected.
To quickly complete a method call of a static method located anywhere in your project, a library or a JDK, enter a prefix and press Ctrl+Space twice. You can press Alt+Enter to import the selected method.

You can jump between the Spring tool window and the corresponding controller with one shortcut. Select the necessary view on the MVC tab of the Spring tool window and press Ctrl+Alt+Home.

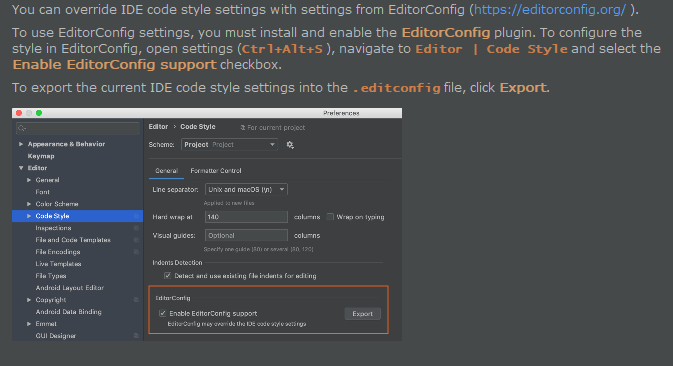
You can override IDE code style settings with settings from EditorConfig (https://editorconfig.org/ ).
To use EditorConfig settings, you must install and enable the EditorConfig plugin. To configure the style in EditorConfig, open settings (Ctrl+Alt+S ), navigate to Editor | Code Style and select the Enable EditorConfig support checkbox.
To export the current IDE code style settings into the .editconfig file, click Export.
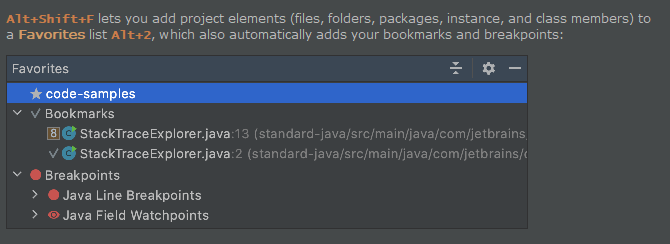
Alt+Shift+F lets you add project elements (files, folders, packages, instance, and class members) to a Favorites list Alt+2, which also automatically adds your bookmarks and breakpoints:
Press Shift twice to open the Search Everywhere popup.
It lets you find any element of your source code, a file, an action, a UI element, or even a Git commit.

Invoking Type-Matching code completion (Ctrl+Shift+Space) twice when a collection type is expected will search for arrays with the same component type and suggest converting them using the Arrays.asList() call.

To open your browser with the documentation page for the element at the caret, press Shift+F1 (View | External Documentation ).
To use this feature, a browser must be selected on the Tools | Web Browsers page of the Settings/Preferences dialog Ctrl+Alt+S.
You can sort completion suggestions by relevance or alphabetically.
To sort alphabetically, select the Sort by Name option.
To sort by relevance, clear the Sort by Name checkbox.

In IntelliJ IDEA, you can configure different copyright notices for different sets of files. For convenience, you can use variables. For example, use $today.year to keep the year up to date.
In the Settings/Preferences dialog Ctrl+Alt+S, select Editor | Copyright | Copyright Profiles, create a new profile, and add the text for your copyright notice using variables.
You can exclude any file from your project so that it is ignored by indexing, inspections, and code completion.
In the Project tool window, right-click the file you want to exclude and select Mark as plain text from the context menu. If necessary, you can always revert the file to its original type by using the Mark as <file type> option.
To view all methods of the implemented interfaces in a class, place the caret at the implements keyword in the class declaration and press Ctrl+Shift+F7:

Press Alt+Enter in the editor to fix a highlighted error or warning, improve, or optimize a code construct. For some intention actions, you can open a preview by pressing Ctrl+Shift+I (View | Quick Definition ).

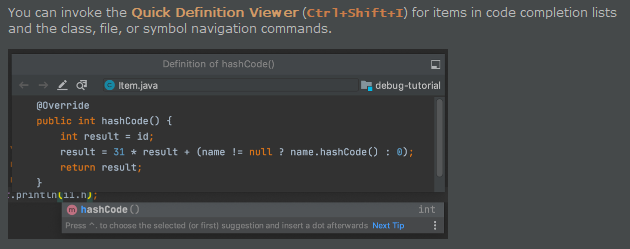
You can invoke the Quick Definition Viewer (Ctrl+Shift+I) for items in code completion lists and the class, file, or symbol navigation commands.
You can start referring to an Ant property or target even if it's not defined yet. Press Alt+Enter and choose Create property from the list of intention actions to create the necessary tag without leaving your current editing location.
IntelliJ IDEA allows you to easily call a Java code from Kotlin:

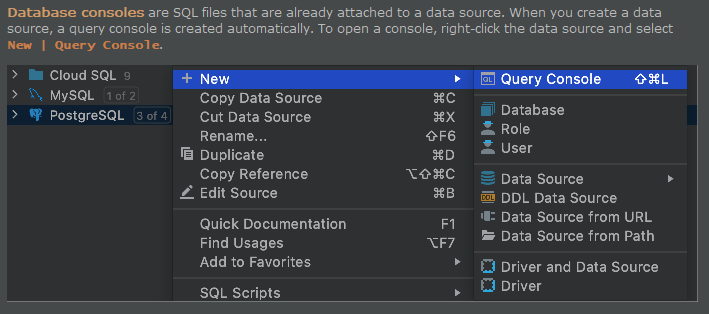
Database consoles are SQL files that are already attached to a data source. When you create a data source, a query console is created automatically. To open a console, right-click the data source and select New | Query Console.
You can easily rename your classes, methods, and variables with automatic correction of all places where they are used.
Position the caret at the symbol you want to rename, and press Shift+F6 (Refactor | Rename ). Type the new name and press Enter.

Press Shift+F6 again to open the Rename dialog that will allow you to search for the provided text in comments and strings.
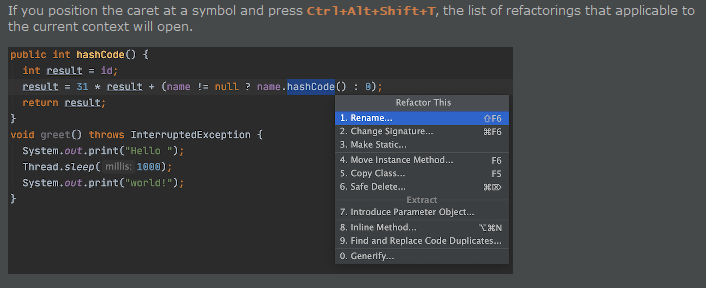
If you position the caret at a symbol and press Ctrl+Alt+Shift+T, the list of refactorings that applicable to the current context will open.
To compare active editor with the Clipboard contents, right-click anywhere in the editor and choose Compare with Clipboard from the context menu.
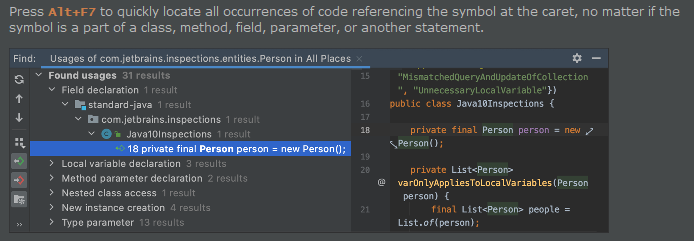
Press Alt+F7 to quickly locate all occurrences of code referencing the symbol at the caret, no matter if the symbol is a part of a class, method, field, parameter, or another statement.
Press Ctrl+F to display the search pane. Press Ctrl+R to add another field where you can type the replace string.
In the Find in Files dialog, you can switch to replace by pressing Ctrl+Shift+R. Similarly, press Ctrl+Shift+F to hide the Replace with field and switch to regular search.
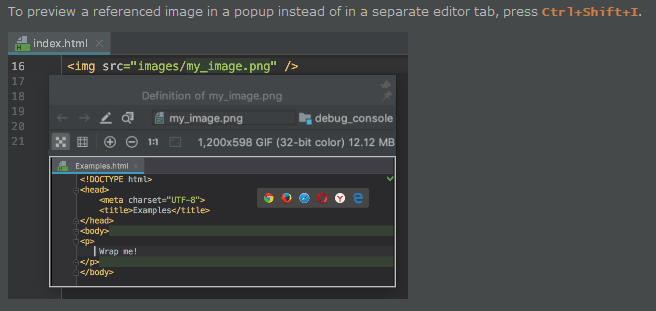
To preview a referenced image in a popup instead of in a separate editor tab, press Ctrl+Shift+I.
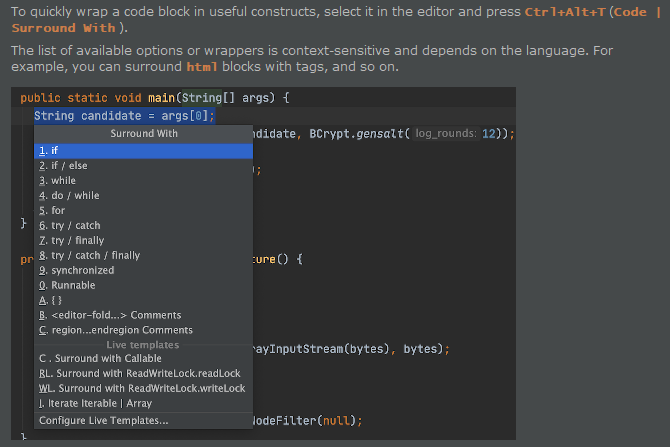
To quickly wrap a code block in useful constructs, select it in the editor and press Ctrl+Alt+T (Code | Surround With ).
The list of available options or wrappers is context-sensitive and depends on the language. For example, you can surround html blocks with tags, and so on.
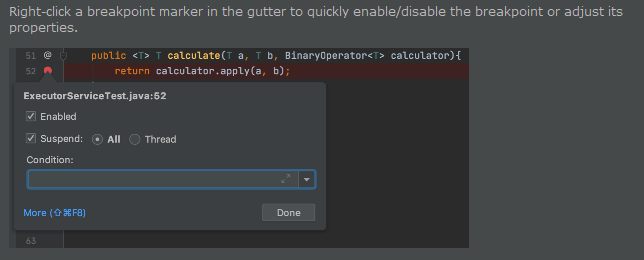
Right-click a breakpoint marker in the gutter to quickly enable/disable the breakpoint or adjust its properties.
You can use Ctrl+Q (View | Quick Documentation ), Ctrl+P (View | Parameter Info ), Ctrl+B (Navigate | Declaration ), and similar shortcuts not only in the editor but also in the suggestions list while using code completion.

You can narrow down the list of code completion suggestions by using camel case prefixes.

To join two lines into one and remove unnecessary spaces, press Ctrl+Shift+J.
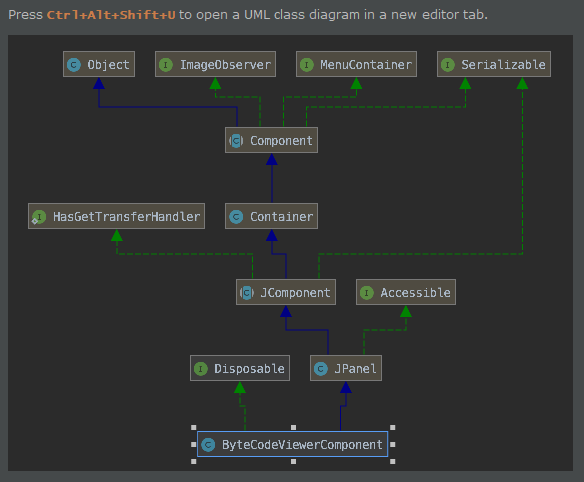
Press Ctrl+Alt+Shift+U to open a UML class diagram in a new editor tab.
To split changes made to the same file between different commits, in the Commit tool window Alt+0 click Diff. Select the checkbox next to each chunk of modified or new code that you want to commit and click Commit. Unselected changes will stay in the current changelist.

To reformat code according to the style defined on the Editor | Code Style page of the Settings/Preferences dialog Ctrl+Alt+S, select Code | Reformat Code from the main menu.
You can also use Code | Optimize Imports to organize import statements according to the project code style settings and remove unused imports.
If you accept a completion suggestion by pressing the exclamation mark (!), this expression will be negated.

Invoking Type-Matching code completion (Ctrl+Shift+Space) twice when an array type is expected will search for collections with the same component type and suggest converting them using the toArray() call.

When you invoke the Move refactoring F6 on an inner class that is declared static, you are prompted to either make it a top-level class, or move it to another class.

IntelliJ IDEA lets you examine the differences between two versions of the same file. You can compare the following:
- a file modified locally with its repository version
- any two revisions of the same file (in the same or in different branches)
- a local file with its versions in Local History
Learn more : https://www.jetbrains.com/help/idea/2021.2/comparing-file-versions.html
Compare file versions | IntelliJ IDEA
www.jetbrains.com
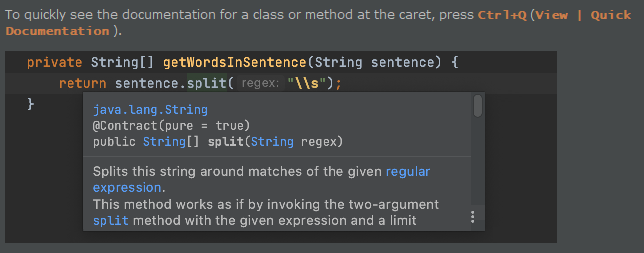
To quickly see the documentation for a class or method at the caret, press Ctrl+Q (View | Quick Documentation ).
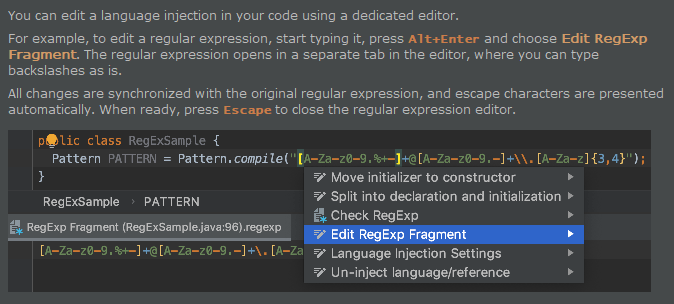
You can edit a language injection in your code using a dedicated editor.
For example, to edit a regular expression, start typing it, press Alt+Enter and choose Edit RegExp Fragment. The regular expression opens in a separate tab in the editor, where you can type backslashes as is.
All changes are synchronized with the original regular expression, and escape characters are presented automatically. When ready, press Escape to close the regular expression editor.
To protect your database from accidental modifications, you can turn on read-only mode for a connection.
To enable read-only mode for a connection, click File | Data sources and select the necessary data source in the Data Sources list. On the Options tab, select the Read-only checkbox.

When debugging, you can evaluate expressions to analyze the flow or prototype improvements:
- if the expression is present in the code, hold Alt (on Windows and Linux) or ⌥ (on macOS) and click it. If you want to evaluate a specific code fragment, select it before clicking.

- to evaluate an arbitrary expression, select Run | Debugging Actions | Evaluate Expression. A separate dialog opens that supports various constructs including loops, assignments, lambdas, and so on.
You can view multiple files side by side in the editor. Right-click the desired editor tab and select how you want to split the editor (Split Right or Split Down ).
Alternatively, drag a tab to any area of the editor to activate split-screen mode.

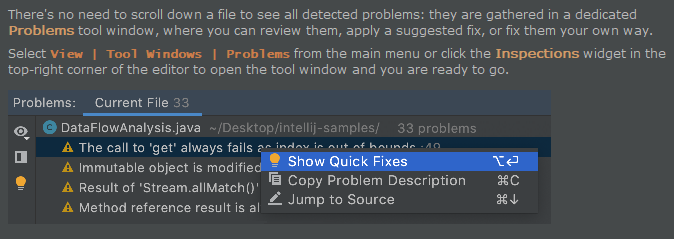
There's no need to scroll down a file to see all detected problems: they are gathered in a dedicated Problems tool window, where you can review them, apply a suggested fix, or fix them your own way.
Select View | Tool Windows | Problems from the main menu or click the Inspections widget in the top-right corner of the editor to open the tool window and you are ready to go.
To make your printouts (File | Print) nice and informative, use keywords.
For example, use $DATE$ and $TIME$ to specify the exact date and time of the printout.
You can accept the current selection in the code completion suggestions list with the period key (.), comma (,), semicolon (;), space, and some other characters.
Press Alt+1 to open the Project tool window and switch focus to it.
Use live templates to insert frequent code constructs.

For example, type psvm and press Tab to insert the main() method declaration template, then type sout to insert a print statement.
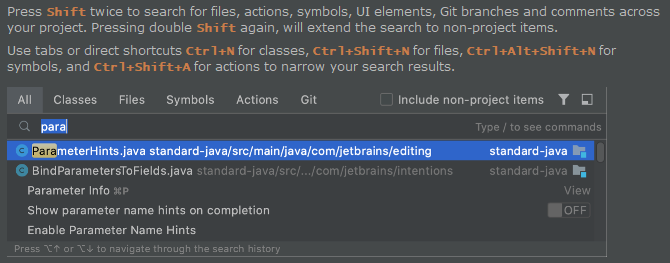
Press Shift twice to search for files, actions, symbols, UI elements, Git branches and comments across your project. Pressing double Shift again, will extend the search to non-project items.
Use tabs or direct shortcuts Ctrl+N for classes, Ctrl+Shift+N for files, Ctrl+Alt+Shift+N for symbols, and Ctrl+Shift+A for actions to narrow your search results.
When some words are missing in the pre-defined dictionaries, you can create your own. A custom dictionary is a .dic text file containing each word on a new line.
All you have to do is add the directories where your dictionaries are stored in Settings/Preferences | Editor | Proofreading | Spelling.
The Code | Move Statement Up/Down actions are useful for reorganizing code lines, for example for bringing a variable declaration closer to the variable usage.
Select a code fragment and press Ctrl+Shift+Up or Ctrl+Shift+Down.
When nothing is selected in the editor, the line at the caret position will be moved.
If a method signature has changed, IntelliJ IDEA highlights the documentation comment tags that ran out of sync and suggests a quick-fix:

Use Refactor | Copy Class to create a class which is a copy of the selected class.
This is useful when you need to create a class similar to an existing one, and it's not feasible to put shared functionality in a common superclass.
Enter "/" in the search field of the Search Everywhere (Shift twice) window to search for a list of settings, their options, and plugins.
You can also search for the URL mappings entering "/" before the part of the URL mapping you are searching for.

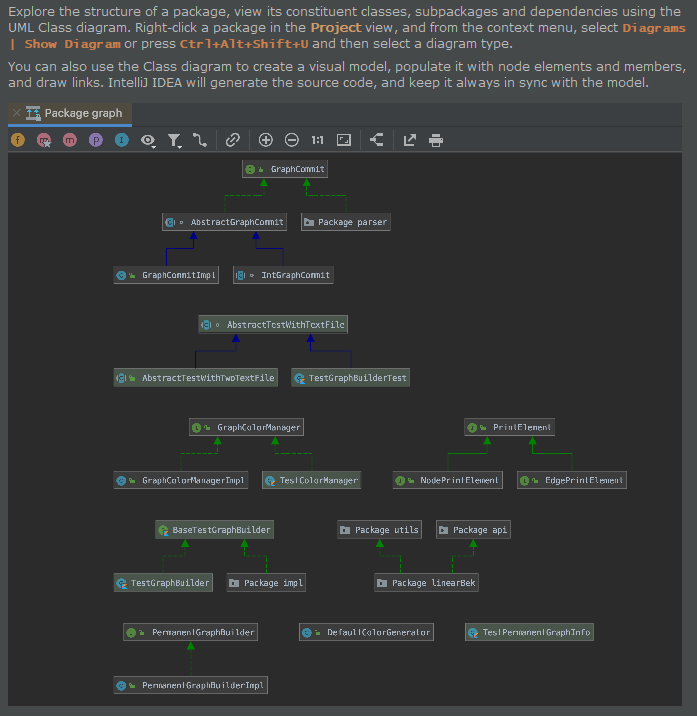
Explore the structure of a package, view its constituent classes, subpackages and dependencies using the UML Class diagram. Right-click a package in the Project view, and from the context menu, select Diagrams | Show Diagram or press Ctrl+Alt+Shift+U and then select a diagram type.
You can also use the Class diagram to create a visual model, populate it with node elements and members, and draw links. IntelliJ IDEA will generate the source code, and keep it always in sync with the model.
Escape in any tool window moves the focus to the editor.
Shift+Escape moves the focus to the editor and hides the current or the last active tool window.
F12 moves the focus from the editor to the last focused tool window.
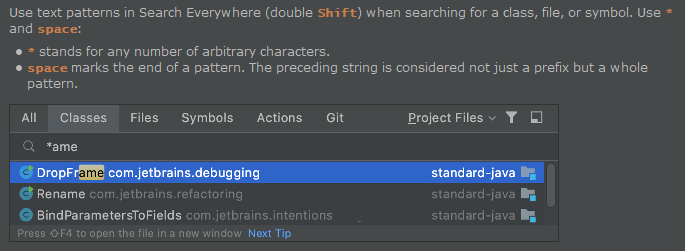
Use text patterns in Search Everywhere (double Shift) when searching for a class, file, or symbol. Use * and space:
- * stands for any number of arbitrary characters.
- space marks the end of a pattern. The preceding string is considered not just a prefix but a whole pattern.
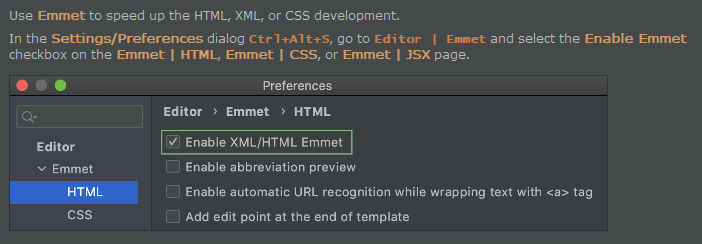
Use Emmet to speed up the HTML, XML, or CSS development.
In the Settings/Preferences dialog Ctrl+Alt+S, go to Editor | Emmet and select the Enable Emmet checkbox on the Emmet | HTML, Emmet | CSS, or Emmet | JSX page.
You can quickly navigate in the currently edited file with Ctrl+F12 (Navigate | File Structure ).
File structure shows the list of members of the current class. To navigate to an element, select the element and press Enter or F4.
To easily locate an item in the list, start typing its name.

Refer to a non-existing target tag in your Ant build file, and IntelliJ IDEA will suggest you to automatically create the corresponding tag. This intention action will not even make you change your current editing location.

IntelliJ IDEA can generate getter and setter methods for fields in your class. With the caret inside the class, press Alt+Insert (Code | Generate ).

You can drag an external file from Explorer or Finder and drop it onto the Favorites tool window Alt+2.
To open a file in the editor at a particular line, press Ctrl+Shift+N (Navigate | File ), start typing the filename, choose from the suggestion list, and then type : followed by the line number.

Use your favorite shell from the built-in Terminal.
In the Settings/Preferences dialog Ctrl+Alt+S, go to Tools | Terminal and specify the path to your shell executable.
If you notice that IntelliJ IDEA works slowly, consider reducing the number of folders under antivirus protection. This may significantly improve performance.
The memory viewer in IntelliJ IDEA allows you to work with a detailed breakdown of HPROF snapshots. Memory snapshots are useful to locate code that uses a large amount of memory, and to search for memory leaks.
To analyze a snapshot, go to Run | Open Profiler Snapshot | Open and select a file with the .hprof extension.
To view all exit points of a method, place the caret at one of them, for example the return statement, and press Ctrl+Shift+F7:

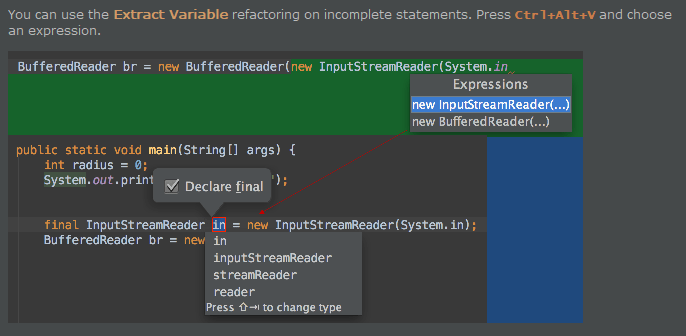
You can use the Extract Variable refactoring on incomplete statements. Press Ctrl+Alt+V and choose an expression.
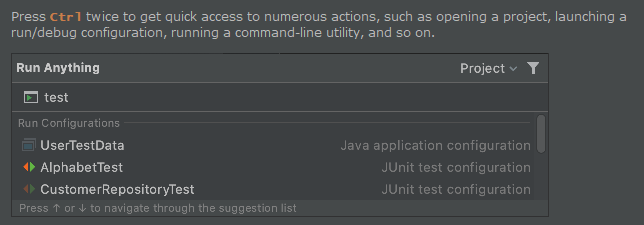
Press Ctrl twice to get quick access to numerous actions, such as opening a project, launching a run/debug configuration, running a command-line utility, and so on.
To select multiple text fragments and modify them, press and hold Shift+Alt (on Windows and Linux) / ⇧⌥ (on macOS) and drag your mouse across the text:

Press Shift twice and search for a Git branch, tag, commit hash, or message to jump to it in the Log view:

Use the Edit | Copy | Copy Path/Reference action to insert a reference to a field/method/class/file into the current position in the editor.
Position the caret within the myMethod method name and press Ctrl+Alt+Shift+C:

To paste the reference, press Ctrl+V:

You can also copy references in the Go to Class/Go to Symbol/Go to File dialogs. Press Ctrl+C on any element in the lookup list.
IntelliJ IDEA provides a quick-fix that automatically installs the package you are trying to import: if, after the import keyword, you type a name of a package that is not currently available on your machine, a quick-fix suggests to either ignore the unresolved reference, or download and install the missing package.
You can use colors to distinguish between your data sources and their elements. To set a color to a data source or its object, right-click the element in the Database tool window (View | Tool Windows | Database) and select Color Settings.

In the editor, press Ctrl+W/ Ctrl+Shift+W to extend or shrink your current code selection.
To see the inheritance hierarchy for the selected class, press Ctrl+H (Navigate | Type Hierarchy ). You can also invoke the hierarchy view directly from the editor to see the hierarchy for the currently edited class.

Click the question mark icon on the Jupyter notebook toolbar to quickly access the list of available shortcuts for basic operations with Jupyter notebook.

You can apply a different code style or coloring scheme or keymap with a single keystroke right from the editor. Press Ctrl+` (View | Quick Switch Scheme) to specify the scheme you want to switch to.

When the Show suggestions as you type option is enabled for code completion, Ctrl+Down and Ctrl+Up will close it and move the caret down or up in the editor.
In IntelliJ IDEA, you can use multiple carets. Press and hold Shift+Alt (on Windows and Linux) / ⇧⌥ (on macOS) and then click at different positions to set additional carets in the editor.

You can then press Shift with the left or right arrow keys to select multiple text fragments.

Press Escape to remove all the carets except for the recently added one.
Press Shift+Enter to execute the current cell in a Jupyter notebook and select the next one: Shift+Enter.
To quickly find and run an inspection, press Ctrl+Alt+Shift+I and start typing the name of the inspection or its group. Choose an inspection from the suggestion list and specify the scope.

To select a rectangular piece of code, drag your mouse while pressing Alt (on Windows and Linux) / ⌥ (on macOS).

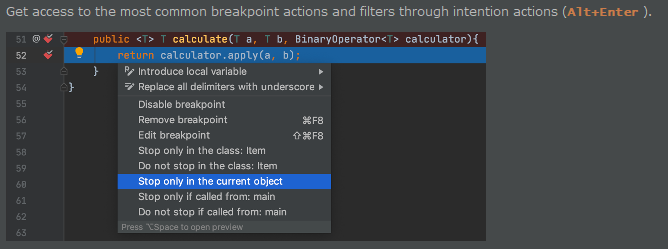
Get access to the most common breakpoint actions and filters through intention actions (Alt+Enter ).
To quickly run all methods in a test class, click ▶▶ in the gutter and select Run '<TestClass>':

To run a single method, click ▶ in the gutter.
The Extract Variable refactoring wraps a selected expression into a variable. It adds a new variable declaration and uses the expression as an initializer. To invoke this refactoring, select the expression and press Ctrl+Alt+V (Refactor | Extract/Introduce | Variable ):
This will result in the following:

To expand selection, press Ctrl+W. Each time you press Ctrl+W, the selection expands to other areas of code.
For example, the selection expands from a method name to the expression calling this method, then to the whole statement, then to the containing block, and so on.
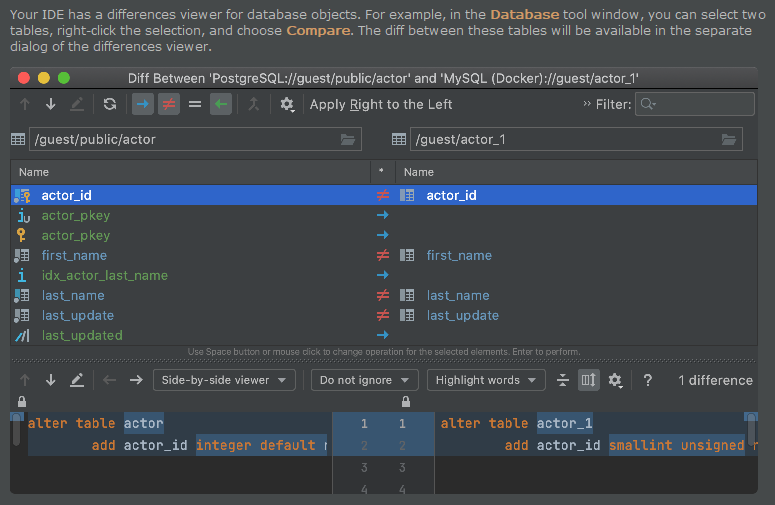
Your IDE has a differences viewer for database objects. For example, in the Database tool window, you can select two tables, right-click the selection, and choose Compare. The diff between these tables will be available in the separate dialog of the differences viewer.
IntelliJ IDEA provides out-of-the-box integration with the following version control systems: Git, Mercurial, Subversion, and Perforce.
Version your application to collaborate on it, as well as to eliminate the risks of storing all of your codebase locally. Press Alt+9 to view the history of the changes in the project or press Ctrl+K to send your local changes to the repository.
One can easily convert any Java class to the Kotlin one with the same semantics.
To do that, just choose Code | Convert Java File to Kotlin File on the main menu:

You can view the list of all usages of a class, method or variable across the whole project, and quickly navigate to the selected item. Place the caret at a symbol and press Ctrl+Alt+F7 (Edit | Find Usages | Show Usages ).
To jump to a usage, select it from the list and press Enter.

Using options in Settings/Preferences | Editor | Reader Mode settings you can configure how to display code and comments in read-only files and libraries to make them easier to read and understand.
You can enable inlay hints, font ligatures, adjust line height, toggle rendered view of comments, and so on.

Press Ctrl+Shift+V to select the text fragment that you have previously copied to the clipboard.
To preview code without actually scrolling to it, hover your mouse pointer over a warning, error stripe, or just some section of source code on the scrollbar, and you will see a lens:

To disable the lens, right-click the code analysis marker at the top of the scrollbar and clear the Show code lens on scrollbar hover checkbox.
Press F2 or Shift+F2 to jump to the next or previous error respectively in the current file.
Kotlin is a powerful, concise and expressive language crafted by JetBrains.
IntelliJ IDEA supports it out-of-the-box.
To create a Kotlin file, right-click the target folder, and choose the corresponding option on the New menu:

You can evaluate simple arithmetical expressions with the Search Everywhere window (Shift twice).
Enter an expression you want to evaluate in the search field. The result will be displayed in the search results.

Use Code | Inspect Code to run code analysis for the whole project or a custom scope and examine the results in a separate window.
When you invoke Basic Completion Ctrl+Space, IntelliJ IDEA suggests the choices that are reachable from the current caret position. Press Ctrl+Space again to also see inaccessible classes and members.
You do not need to open a file in the editor to change its line separator style. Use the Project tool window instead: select one or more files or folders, select File | File Properties| Line Separators from the main menu, and then choose the desired line ending style.
For a directory, new line separator applies recursively.
Press F2/ Shift+F2 to jump between the highlighted syntax errors.
Press Ctrl+Alt+Up/ Ctrl+Alt+Down to jump between error messages or search results.
To skip warnings, right-click the validation side bar / marker bar and choose Go to high priority problems only.
Welcome to IntelliJ IDEA 2021.2
You can get familiar with the main features of the IDE by following these tips. You can try out the features without closing this dialog. If you close it, you can always get back to it by selecting Help | Tip of the Day from the main menu.
To quickly add code cells in Jupyter notebooks, press Shift+Alt+A to insert a new cell above the currently selected cell, or Shift+Alt+B to create a new cell below the selected cell.
You can inject Spring entities, such as bean names and resource paths. Press Alt+Enter and select Inject language or reference | Spring Bean Name.

Apply the differences between panes in the Differences viewer using the chevron buttons:
To append the contents of the current pane to the other pane, keep Ctrl pressed. The buttons will change to .
To revert changes, keep Shift pressed. The chevrons turn into X.
You can create code constructs using statement completion. Start typing a method declaration, a method call or a statement such as if, do -while, try -catch, or return. Press Ctrl+Shift+Enter to complete the statement into a syntactically correct construct.

If you want to process data from a Collection using a Stream, start typing the Stream method right on a Collection instance. IntelliJ IDEA will get the Stream instance for you.

To select several words, press and hold Shift+Alt (on Windows and Linux) / ⇧⌥ (macOS), and double-click each word you want to select.

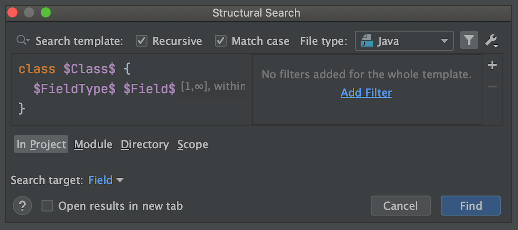
To search for a code pattern or a grammatical construct, select Edit | Find | Search Structurally.
If nothing is selected in the editor, press Ctrl+C to copy the whole line at the caret to the clipboard.
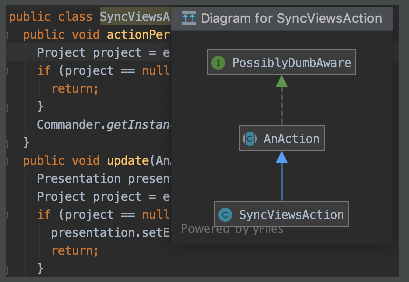
Press Ctrl+Alt+U to open a UML class diagram in a popup window.
Press Ctrl+E (View | Recent Files) to view the list of recently opened files.
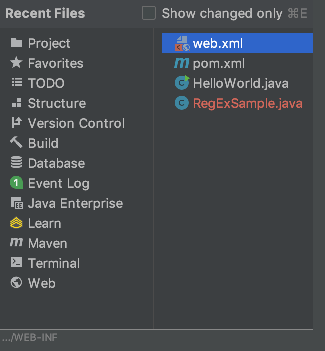
You can also bring up the results of the recently performed usage searches. For this, go to Edit | Find | Recent Find Usages or select Recent Find Usages from the context menu of the Find tool window:

If you do not remember a live template abbreviation, press Ctrl+J to see a list of suggestions for the current context.

When you double-click a table in the Database tool window (View | Tool Windows | Database ), the table opens in the data editor.
In the data editor, you can create and delete new entries, modify existing ones, filter data by a column, view data in the separate viewer, and compare two tables.

Invoking Type-Matching code completion (Ctrl+Shift+Space) twice when there's an array of the expected type in the context will suggest getting an element from this array.

You can copy text from the editor as rich text to paste it into any other editor that recognizes RTF.
Make sure the Copy as rich text checkbox is selected on the Editor | General page of the Settings/Preferences dialog Ctrl+Alt+S.

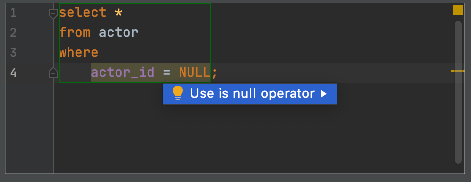
Database Plugin warns you if you use the equals sign in the clause where IS NULL seems more appropriate. To fix this, press Alt+Enter and select Use IS NULL operator.
IntelliJ IDEA features the Inspections widget that is located in the top-right corner of the editor and displays the number of all problems detected in the current file, from errors to typos.
Click the widget to take a closer look at each problem in the dedicated tool window and apply the most suitable fix. You can jump from one problem to another within a file by clicking the arrows.

Press Ctrl+Shift+F7 (Edit | Find Usages | Highlight Usages in File) to quickly highlight usages of a certain variable in the current file.
Press F3 and Shift+F3 to navigate through the highlighted usages.
Press Escape to remove highlighting.

To scroll a file horizontally, turn the mouse wheel while keeping Shift pressed.
Speed search is available in all tree views: start typing and you'll quickly locate the necessary item.

Press Ctrl+Y in the editor to delete the whole line at the caret.
To avoid accidentally removing breakpoints, you can choose to remove them by dragging them from the gutter. Press Ctrl+Alt+S, go to Build, Execution, Deployment | Debugger and select Drag to the editor or click with middle mouse button.
Click a breakpoint to enable or disable it.
If you see a highlighted command in the Terminal, do not execute it right away. Instead, press Ctrl+Enter (for Windows and Linux) / ⌘↩ (for Mac) to activate the corresponding IDE feature.

For example, try git log to view the Log tab of the Git tool window or diff with the names of files to open them in the diff viewer.
To compare any two files or folders, select them in the Project tool window and press Ctrl+D.
To run a query, right-click a query and select Execute or use a shortcut (Cmd + Enter for macOS, Ctrl+Enter for Windows and Linux).

To verify that your regular expression is correct, place the caret within the expression you want to check, press Alt+Enter, and select Check RegExp.
In the popup, type a sample string that should match your regular expression. The icon shows that the match occurred. The ( ! ) icon shows that there is no match or your expression contains a mistake.

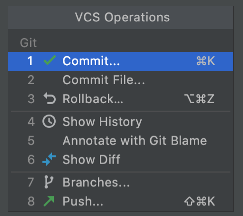
To access all VCS-related commands available in the current context, press Alt+`.
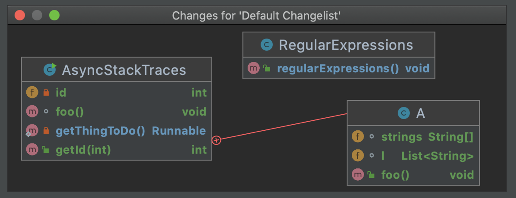
If your project is under version control, you can build a UML diagram that reflects your local changes and visualizes relationships between the modified components.
Press Ctrl+Alt+Shift+D and select the necessary changelist to build the diagram. Double-click a node on the diagram to see the change in the diff dialog.
IntelliJ IDEA makes it easy to specify colors in CSS files. The color properties have icons of the corresponding color in the editor gutter. Click the icon to choose the desired color using the color picker.
Code Completion Ctrl+Space helps you quickly complete code statements. It works as you type and gives a list of suggestions available from the current caret position:

When searching for a text string in a file, use recent search history. Press Ctrl+F to open the search pane and then press Alt+Down to show the list of recent entries.

Press Ctrl+Shift+I (View | Quick Definition) to preview the definition or content of the symbol at the caret, without opening it in a separate editor tab.

If you want to log program state during debugging, use non-suspending breakpoints. Select the expression that you want to log, hold Shift, and click the gutter at the line where the expression should be logged.

In the example, sent.size() will be logged upon reaching line 24.
To switch between opened files and tool windows, use the Switcher Ctrl+Tab. For navigation, press and hold Ctrl (on Windows and Linux) / ⌘ (on macOS) and use the Up and Down arrow keys or Tab and Shift+Tab, and Alt.
Press Delete or BackSpace to close an editor tab or hide a tool window.
Use shortcuts to comment and uncomment lines and blocks of code:
- Ctrl+/: for single line comments (//...)
- Ctrl+Shift+/: for block comments (/*...*/)
Invoking Type-Matching code completion (Ctrl+Shift+Space) twice will search for chained expressions of the expected type.
You can jump to a file located in a deeply nested directory by pressing Ctrl+Shift+N and typing several characters of the enclosing directories and filename. Use either a slash or a backslash as a delimiter.

Scratch files are temporary files that let you experiment and prototype in the editor, without creating any project files.
To create a scratch file, press Ctrl+Alt+Shift+Insert, and then select the language to use.
To navigate to the implementations of an abstract method, position the caret at its usage or its name in the declaration and press Ctrl+Alt+B.


댓글